Figures below are fee benchmarks on vendor sites as of September 2026. Always confirm current rate sheets and written quotes before contracting. When comparing a one-off museum show with multiple municipal events on the same rate table, watch whether fixed per-event fees flip the total ranking.
Recommended order: 1. Split fee types → 2. Pull latest rate sheets → 3. Per-event total examples → 4. Check quote gaps → 5. Narrow to 2–3 vendors on price; use the event-system pillar for features. Below follows this order.
Fee types | What counts in event ticket sales
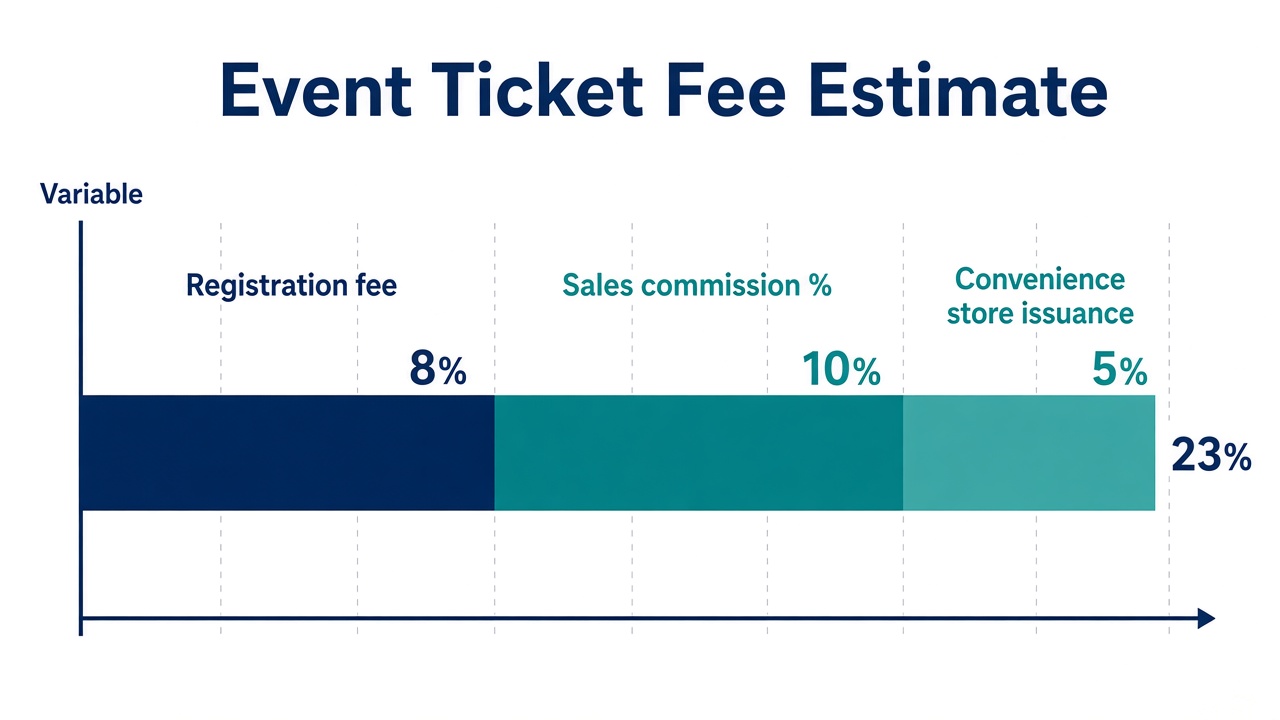
For cloud ticket sales on a single run—municipal festivals, venue shows, mall events—quotes usually mix more than a single sales fee percentage:
- Event registration fee — fixed per event (may vary by plan)
- Sales fee (usage-based) — unit price × quantity × rate; presale vs general rates may differ
- Issuance and payment — convenience-store pickup, cards, carrier billing (often separate rows)
- Options — lotteries, assigned seating, streaming links (quote separately)
Comparing “8% only” can reverse totals for small events when a ¥5,000 registration fee (ex tax) is included or not. Note expected ticket volume before building a comparison table.
Usage-based vs fixed registration | Comparison patterns
Table scrolls horizontally
| Pattern | How billing works | Typical scale |
|---|---|---|
| Usage-first | Low or zero setup + sales fee %. Tracks revenue | First-time, small–mid events, a few runs per year |
| Registration + usage | Fixed registration + different % for presale / general | Assigned seats, lotteries, mid–large events, distribution focus |
e+ WOS fee example. On the e+ WEB Open System (WOS) plan table, Light (¥5,000 registration ex tax + 8% sales fee, etc.) and Standard (¥10,000 registration + 8% presale / 10% general, etc.) show fixed + usage side by side (plans split by general vs assigned seating). Use the site’s fee simulator and service PDF (updated July 2026) for detail.
Ticketme fee example. Ticketme often lists no initial fee and usage-based plans, with public-sector case studies and around 5% on their site (varies by plan). Before quoting, check the Ticketme organizer site (5% fee, zero initial fee) for current rates.
Sample estimate | One-event total
In ticket sales fee comparison, a common first step is to estimate sales fees only with placeholders (convenience store, refunds, and registration are separate):
- ¥3,000 × 500 tickets = ¥1.5M revenue
- 8% usage only → about ¥120,000 sales fee
- + registration (example: ¥5,000–10,000 ex tax)
Multiple runs per year, mixed presale/general, or different convenience-store ratios mean the same rate does not yield the same total. Ask vendors for a one-event line-item table.
Example 2 — add convenience-store share. At the same ¥1.5M revenue, assume Web 70% / convenience store 30%; pickup fees (per ticket or extra %) add on top. Read the “issuance” row and note volume by channel before comparing.
Example 3 — two vendors, different rates. Vendor A: no registration + 8%; Vendor B: ¥10,000 registration ex tax + 5%. At 500 × ¥3,000, B may win on total; at 200 tickets, A may win because of registration. Re-run ticket sales fee comparison with your own quantity and price.
Before you sign | Checklist
| Item | Why it matters |
|---|---|
| Quote scope | Web only, or includes convenience store, box office, refund fees |
| Presale / general rates | Whether % splits within one event |
| Cancellation / postponement | Refund operation charges |
| Quote-only items | Features not on the public site—confirm line items |
| Convenience store / box office | Whether pickup fees are inside sales fee or separate |
| Refunds / cancellation | Refund fees, admin fees, organizer share |
When requesting quotes from several vendors, send the same brief so answers align:
- Event name, date, venue (one run)
- Ticket types, unit price, expected volume (presale / general split)
- Channel mix placeholder (Web / convenience store / day-of)
- Assigned seating, lottery, refund policy assumptions
Finance and IT teams should also ask whether you receive one invoice per event or an annual contract with flat registration. More runs per year changes how fixed registration looks even at the same sales fee rate.
Ask for a table with registration, issuance, payment, and refunds, not “sales fee X%” alone. Use Comparing event ticket sales systems for feature fit; this article focuses on apples-to-apples fee totals.
See features and rollout examples on the service site.
FAQ
Q1. Which service has the lowest fees?
Rate alone does not decide. Totals shift with volume, unit price, registration, and pickup mix. Send the same assumptions to two or three vendors and compare itemized quotes.
Q2. How is this different from “Comparing event ticket sales systems”?
Comparing event ticket sales systems covers shortlisting, operations, and SaaS limits. This article focuses on fee breakdown and one-event totals.
Q3. Can I use the same table for passes or subsidy vouchers?
No. Product design and settlement differ, so event SaaS rate tables do not transfer. Use a separate quote model for passes and vouchers.
Summary
1. Memo volume and channels. 2. Copy variable/fixed/issuance rows from rate sheets. 3. Build same-assumption total table. 4. Require split fee table in RFP. 5. Shortlist on price; finalize features via the event-system article.
Related service
SmartPlate Ticket
See features and rollout examples on the service site.